Demand and Supply.
These are the two words that are commonly used by economists.
What does it mean?
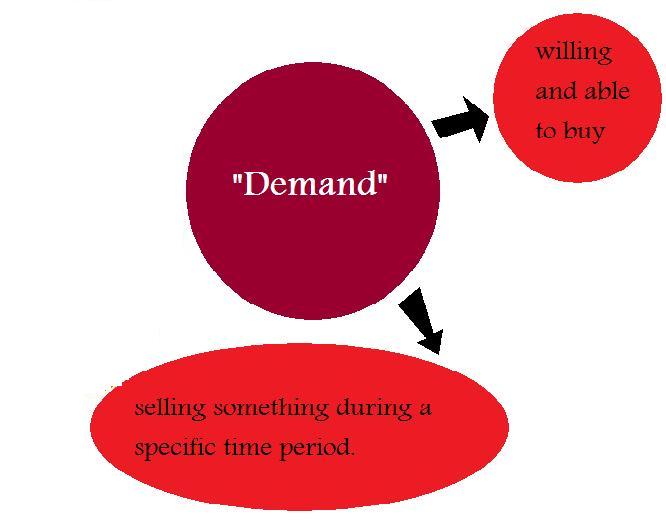
The mind map pasted on the right shows a simple definition of the term "demand".
According to the businessdictionary.com,
There are three definitions for it.
- Desire for certain good or service supported by the capacity to purchase it.
- The aggregate quantity of a product or service estimated to be bought at a particular price.
- The total amount of funds which individuals or organizations want to commit for spending on goods or services over a specific period.
Read More:

A good example is the amount of swimming suits sold in winter VS the amount sold in summer.
Well, obviously the amount of swimming suits sold in SUMMER would be having higher demands compared to the ones sold in Winter. This also shows that the demands affects the number of swimming suits produced.
Which will lead us to the term called, "supply".

The mind map on the left will show you a simple definition of it.
According to the businessdictionary.com, supply is the total amount of profuct (goods or services) available for purchase at any specified price.
Read More:
Relationship between demand and supply.
The relationship between the demand and supply can be presented in graph forms.
But first we have to learn the relationship between the quantity demand and the prices.
The diagram below shows the inverse relationship.

When the price increases, the quantity demand decreases. It is because no one will buy once the price increases especially for items that are not meant to be expensive, such as Flour, and Rice Grains.
When the quantity demand increases, the price will eventually decrease.
The graph pasted on the right is the graph for demand, and the following graph is for supply.
The higher the price, the lower the quantity. The line will be directing downwards.
The graph pasted below is the graph for the supplies.
The higher the quantity, the lower the price. The line will be directing upwards.
Once the two lines meet up with each other (the transaction , it will create the equilibrium graph. This is when the buyer (customers) agrees to buy the same amount that the seller wants to sell. In an easier term, it can be bought and sold.

Surplus- Surplus is when the consumers are able to pay more, if the price increases.
Nice informative Post. Demand and Supply study material to be learn
ReplyDelete